Finovia
AI Based Forecast Finance Report
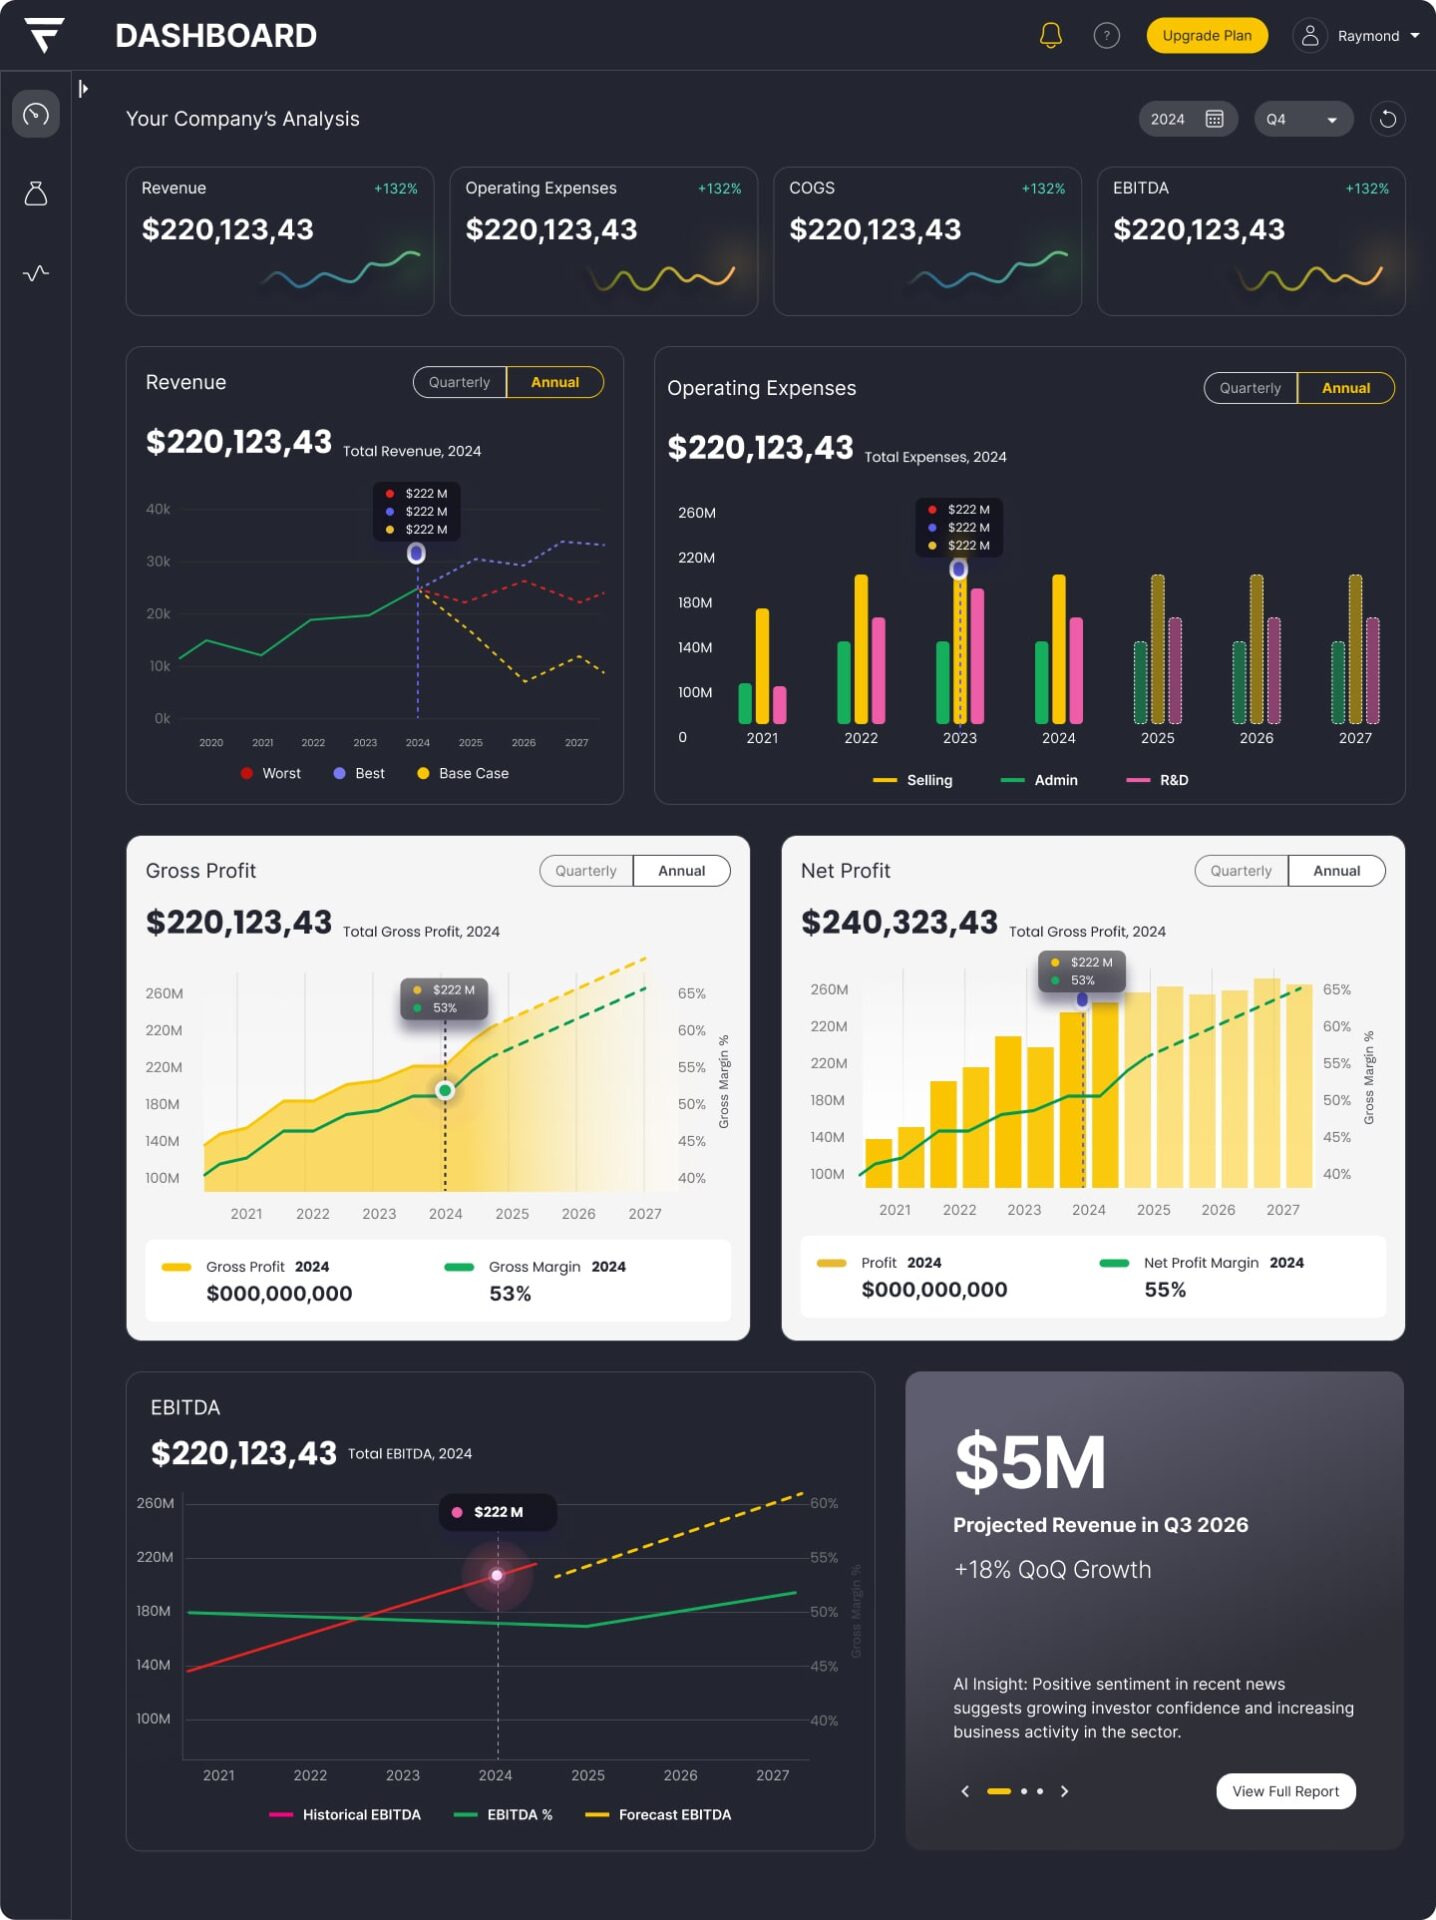
Finovia is an advanced AI-powered financial forecasting and analytics platform designed to help businesses track and predict key financial metrics. The app provides detailed reports on company revenue, gross profit, profit and loss, operating expenses, and EBITDA, empowering businesses to make data-driven financial decisions with confidence.

Problem Statement
Financial analysis tools in the market often present complex data in an overwhelming manner, making it difficult for executives, financial analysts, and business owners to extract meaningful insights. Finovia needed an intuitive, user-friendly, and visually compelling interface to simplify complex financial reports and make forecasting accessible to all stakeholders.
Project Goals
User-Centric Dashboard: Develop an intuitive and interactive dashboard to present key financial insights at a glance.
Data Visualization: Implement clear and engaging charts, graphs, and AI-driven predictive analytics.
Seamless Navigation: Enhance accessibility and ease of use for financial and non-financial users.
Customization: Allow users to personalize reports based on specific business needs.
AI-Driven Forecasting: Integrate AI-powered analysis to provide accurate revenue, expense, and profitability predictions.
Design Process
User Research & Competitive Analysis
- Conducted stakeholder interviews with financial analysts, CFOs, and business owners.
- Analyzed competitors to identify pain points and best practices.
- Mapped out user personas and journey flows to align design with real-world usage.
UI/UX Design Implementation
- Designed a visually appealing interface with color-coded financial indicators.
- Ensured responsive design for both desktop and mobile access.
- Integrated dynamic data visualization tools such as bar charts, pie charts, and trend graphs.
Usability Testing & Iteration
- Conducted A/B testing to refine navigation and user engagement.
- Gathered feedback from beta testers to improve user interactions.
- Enhanced accessibility with tooltips, contextual help, and simplified terminology.
Key Features
- Real-Time Revenue & Gross Profit Tracking: Users can monitor financial health with AI-generated insights.
- Profit & Loss Analysis: Detailed breakdown of income and expenses, enabling better financial planning.
- Operating Expenses Management: Visualized cost distribution and expense trends to optimize spending.
- EBITDA Forecasting: AI-powered predictive analytics providing accurate profitability projections.
- Customizable Reports: Users can generate tailored reports based on their business needs.
- AI-Powered Insights: Automated recommendations for cost savings and revenue growth.
Results & Impact
- 40% improvement in decision-making speed for financial analysts.
- Increased user adoption due to intuitive UI and enhanced data visualization.
- Enhanced accuracy in financial forecasting through AI-driven analysis.
- Positive client feedback, highlighting ease of use and clarity in financial reporting.
Conclusion
By leveraging AI-driven financial insights and a user-first approach, Finovia successfully transformed financial reporting into an intuitive and engaging experience. This project reinforced the importance of simplicity in UX design for data-heavy applications, allowing businesses to make informed decisions with confidence.

Home Wifi Alert

Home Wifi Alert
Let’s Talk Design
I’d be thrilled to discuss how user-first design drives engagement and sustainable growth at your event.
 Network and Security